How to Measure Customer Understanding using Video Analytics?

Publishing a support video and assuming customers understand it are two very different things. Yet most teams treat upload as the finish line.
According to research, 55% of people watch online videos in full, which means nearly half of your customers are dropping off before your support video is done. For a complex workflow tutorial, that number can be far worse. And when a customer doesn't finish a support video, they don't self-serve — they open a ticket, ask a colleague, or quietly give up on the feature entirely.
Video analytics changes that equation. Instead of guessing whether your support content is working, you get precise data on where customers disengage, which videos get replayed, which ones go unwatched, and which ones actually correlate with a drop in support requests. This post breaks down the metrics that matter, what they tell you about customer understanding, and how to act on them — so your support videos do the job they were built for.
Why "views" is the wrong metric for support videos
Views tell you that someone clicked play. They tell you nothing about whether that person understood what they watched, completed the workflow shown, or found the answer they were looking for.
For marketing videos, a view has value — it's an impression, a touchpoint, a brand signal. But support videos exist for a different purpose entirely. They are meant to produce a specific outcome: a customer who can independently complete a task, troubleshoot a problem, or adopt a feature without needing human help.
Measuring support videos by view count is like measuring a customer service call by whether the phone rang. The right question isn't "did they watch it?" — it's "did they understand it, and did it change what they did next?"
Video analytics makes that question answerable. The metrics below are the ones that actually reveal customer comprehension — and where it breaks down.
The video analytics metrics that reveal customer understanding
Watch time and completion rate
Completion rate is the most direct proxy for comprehension available in video analytics. If a customer watches 90% of a tutorial, there's a reasonable chance they absorbed the content. If they drop off at 40%, something went wrong — the video lost them, the explanation was unclear, the pacing was off, or the content didn't match what they needed.
Completion rate becomes even more useful when analyzed alongside your support ticket volume. If a video covering a specific feature has a low completion rate and that feature generates high ticket volume, you have a clear signal: customers are starting the video but not finishing it, which means they're not resolving their question, and they're ending up in your queue.
Tracking this across your full library gives you a prioritized list of where to focus improvement effort — not based on guesses, but based on actual watch behavior.
Drop-off points
Where specifically in a video do viewers stop watching? This is one of the most actionable pieces of data video analytics provides, and it's almost always surprising.
A sharp drop-off at a specific timestamp tells you something definitive: the video is losing viewers at that exact moment. The reason could be that a step is poorly explained, that the narration is unclear, that the video suddenly requires something from the viewer they weren't prepared for, or that the visual doesn't match what the voiceover is describing.
When you find a drop-off point, you know exactly where to look. Revisit that segment, watch it without your prior knowledge of the workflow, and ask whether it makes sense to someone encountering it for the first time. In most cases, a targeted edit to those 15–30 seconds resolves the issue, and completion rates improve measurably as a result.
For teams already using screen capture videos for support, drop-off analysis is the fastest way to identify moments where the visual and the narration have drifted apart.
Replay and rewind behavior
When a viewer rewinds a section and watches it again, they're telling you something directly: they didn't understand it the first time.
Replay events at specific timestamps are a highly reliable indicator of comprehension difficulty. They show up where terminology is unfamiliar, where a step moves too fast, or where the explanation assumes knowledge the viewer doesn't yet have. Unlike drop-offs — which tell you where you lost someone — replays tell you where you almost lost them. The viewer is still trying. They want to understand. But the content isn't making it easy enough.
Treating replay clusters as improvement opportunities rather than engagement signals leads to consistently better support content. A segment that gets replayed frequently should be slowed down, re-narrated, or broken into two parts — not celebrated as a "popular moment."
Video-to-ticket correlation
This is the most powerful measurement a support team can make, and it requires connecting two data sources that often live in separate systems: video analytics and your helpdesk.
The methodology is straightforward: track support ticket volume for specific features or workflows before and after you publish a video addressing them. If ticket volume for that topic drops after the video goes live, the video is working. If it doesn't, the video isn't producing the outcome it was created for — regardless of how many views it has.
Doing this consistently across your support video library gives you a direct measure of ROI and a clear picture of which content is genuinely helping customers understand your product versus which content exists without producing self-service results. Teams that act on this data typically see steady ticket volume reduction as they iterate on underperforming videos. For a deeper look at how this plays out operationally, how to reduce customer support tickets with video tutorials breaks down the mechanics in detail.
Unique viewers versus repeat viewers
A high ratio of repeat viewers on a support video is a quiet warning sign. It can mean that customers are watching the video more than once because they didn't understand it the first time — they need to go back and watch again before they feel confident completing the task.
Some repeat viewing is normal and even positive. A customer following along with a tutorial in real time, pausing and rewinding as they work through the steps, is engaging deeply with the content. But a pattern of customers watching a video two, three, or four times before a task makes sense, suggesting the content isn't landing on the first pass. Combined with replay data and ticket volume, repeat viewer patterns help confirm whether a video needs a structural revision.
Search-to-video conversion
If your support content lives in a video knowledge base, another critical metric is how many users search for help, find a video, and then watch it versus how many search and leave without engaging with any content at all.
A low search-to-video conversion rate means customers can't find the video they need — or the video that exists doesn't appear relevant based on its title or thumbnail. This is often a titling and discoverability problem rather than a content problem. Renaming videos to match the exact language customers use when they search — rather than the internal product terminology your team uses — consistently improves this metric.
How video tutorials enhance your knowledge base SEO covers how the way you structure and title your support video library directly affects whether customers can find answers before they turn into tickets.
What to do when analytics reveals a comprehension gap
Data without action doesn't reduce support load. Once analytics surfaces a problem — low completion rate, sharp drop-off, high replay clusters, no ticket reduction — the next question is how to fix it efficiently.
The most common issues and their solutions follow a predictable pattern. A drop-off in the first 15 seconds almost always means the video's opening doesn't immediately address the question the customer came with — fix it by leading with the outcome, not a preamble. A drop-off mid-video usually means a step was moved too quickly, terminology was unclear, or the visual diverged from the narration — fix it by slowing that segment down or re-narrating it with more context. High replay on a specific step means that step needs to be broken apart or explained differently.
The advantage of AI-powered video tools like WowTo is that these edits don't require re-recording. You adjust the script, regenerate the audio, and the video updates — preserving the original screen capture while replacing the narration with a clearer version. For teams managing a large support library, this is what makes iteration sustainable. Repurposing existing help docs into how-to videos illustrates a similar principle: the work you've already done is the foundation, and the refinement loop is what turns good enough into genuinely effective.
How WowTo connects video creation to video analytics
Most teams run into a friction point: their video creation tool and their analytics live in separate systems, which makes the feedback loop slow. WowTo is built to close that gap.
When you create support videos with WowTo, analytics are built in from the start. Watch time, completion rate, drop-off points, and engagement data are available at the video level and across your entire library — without setting up a separate analytics integration or exporting data to a third tool. The result is a single workflow: create, publish, measure, and improve without switching platforms.
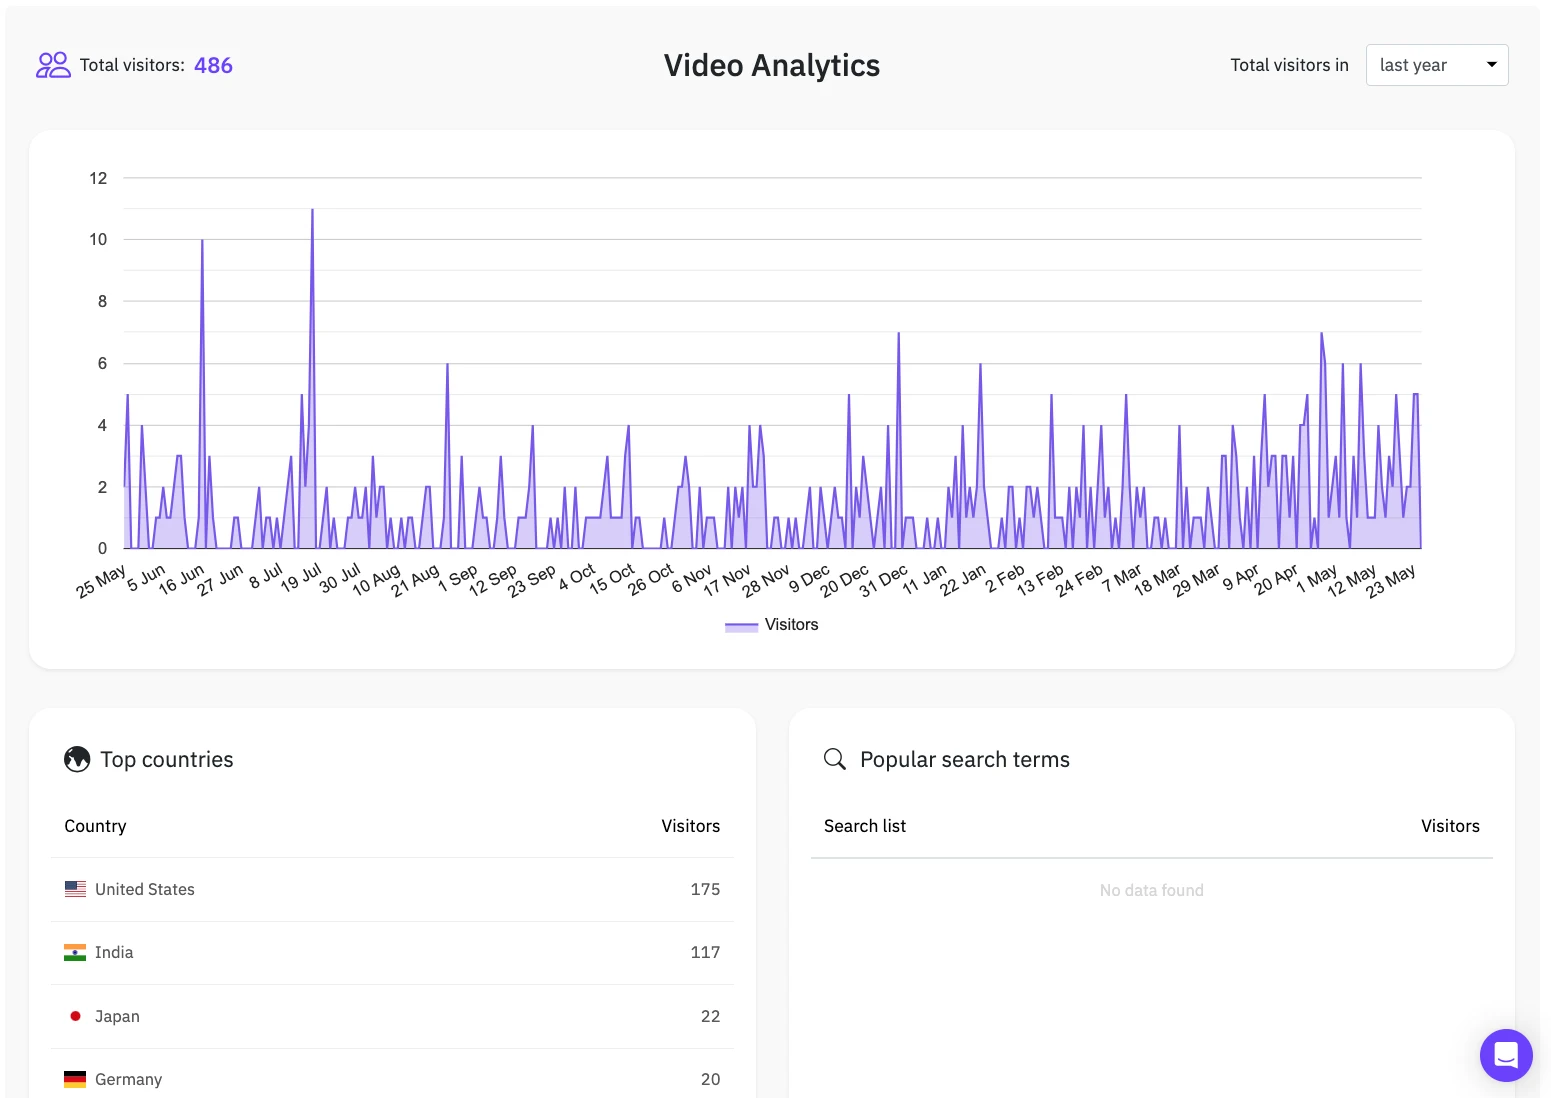
This also means that when analytics flags a video for revision — low completion, high replay at a specific timestamp, no reduction in related tickets — the edit happens in the same place. Adjust the script, regenerate the AI voiceover, and update the video. No re-recording, no production cycle, no waiting.
For teams building out a help center or customer education program, WowTo's video knowledge base provides the hosting layer that makes analytics actionable at scale — surfacing engagement data organized by video, by topic, and by time period so it's easy to spot what's working and what isn't across your full support library.
Using analytics to improve customer success outcomes
Video analytics isn't just a tool for fixing broken content — it's a strategic input for your broader customer success and onboarding programs.
Patterns in watch behavior reveal which parts of your product customers find confusing, which workflows they return to repeatedly, and which features they never engage with because they don't understand how to use them. That data is useful well beyond the support team. Product teams can use it to identify UX friction points. Customer success teams can use it to proactively reach out to customers who watched an onboarding video but didn't complete it. Onboarding programs can be restructured around the videos that actually correlate with feature adoption.
How customer success teams can use video guides explores how this kind of analytics-driven approach shifts the customer success function from reactive to proactive — catching comprehension gaps before they become churn signals.
Similarly, for SaaS teams who've built their support around tutorial videos, how SaaS startups can use tutorial videos to replace live demo calls shows how understanding which videos produce real comprehension — as opposed to passive views — changes how you structure the entire customer education journey.
Conclusion
Start building a support video knowledge base you can actually measure — sign up for WowTo free today. Get started at app.wowto.ai
